 Share the greeting
NIFTY · BANKNIFTY · SENSEX
Index options, read at a glance.
Live open interest, levels and scenarios on one screen. Every scenario is graded after the close, misses included.
Free in beta with an account · Not investment advice · Sign in
What you see
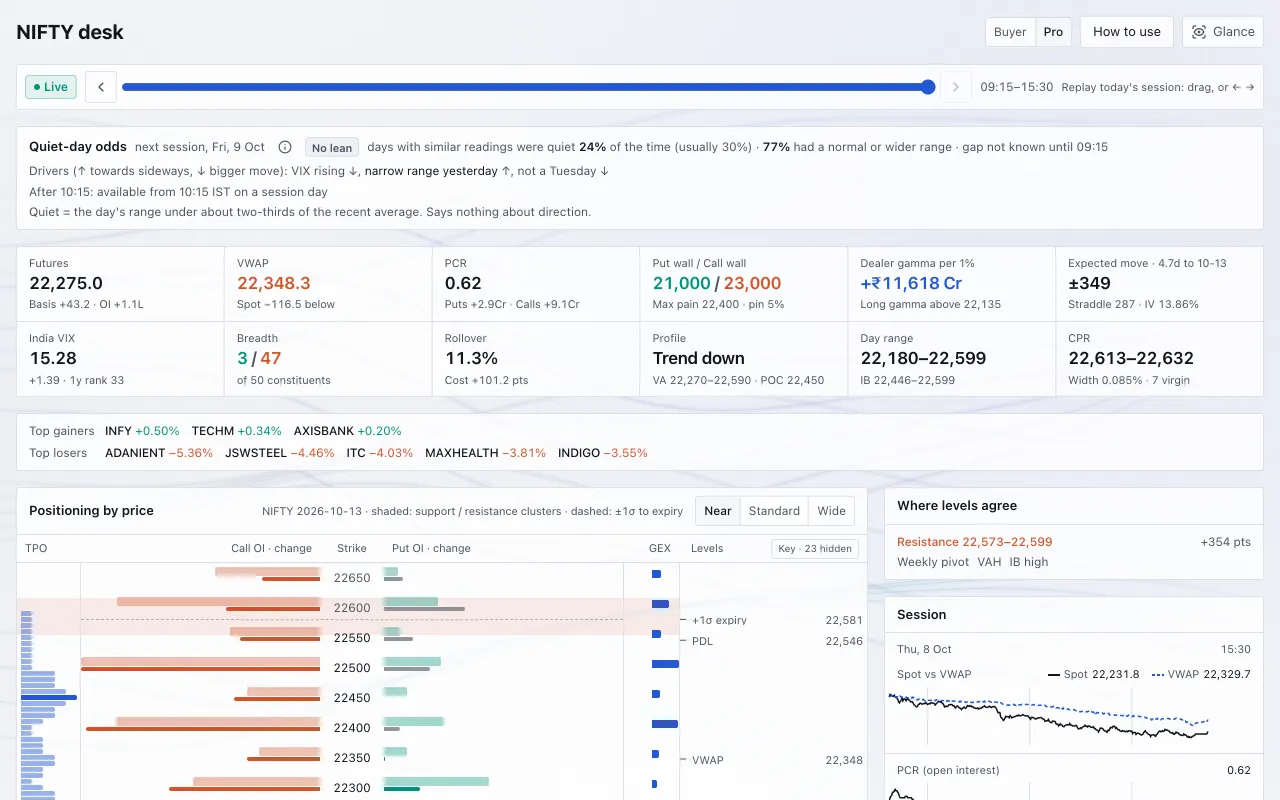
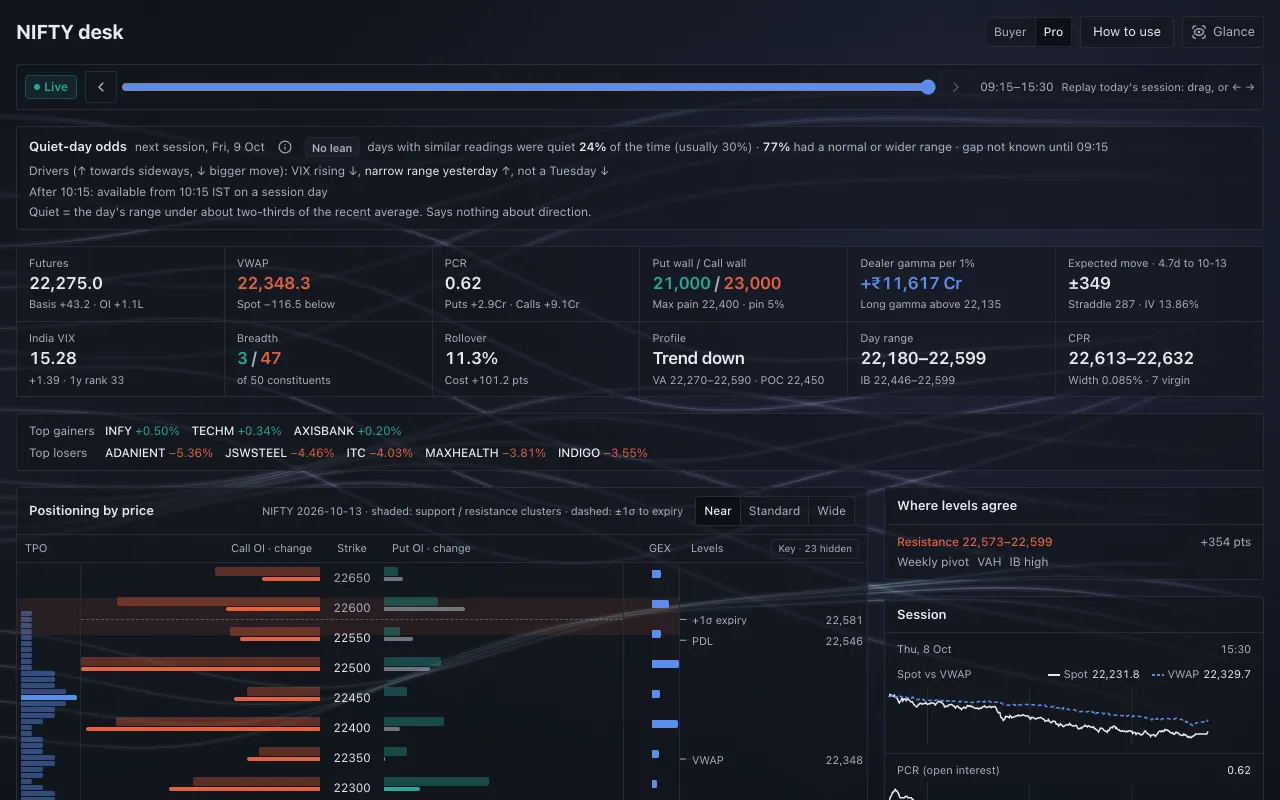
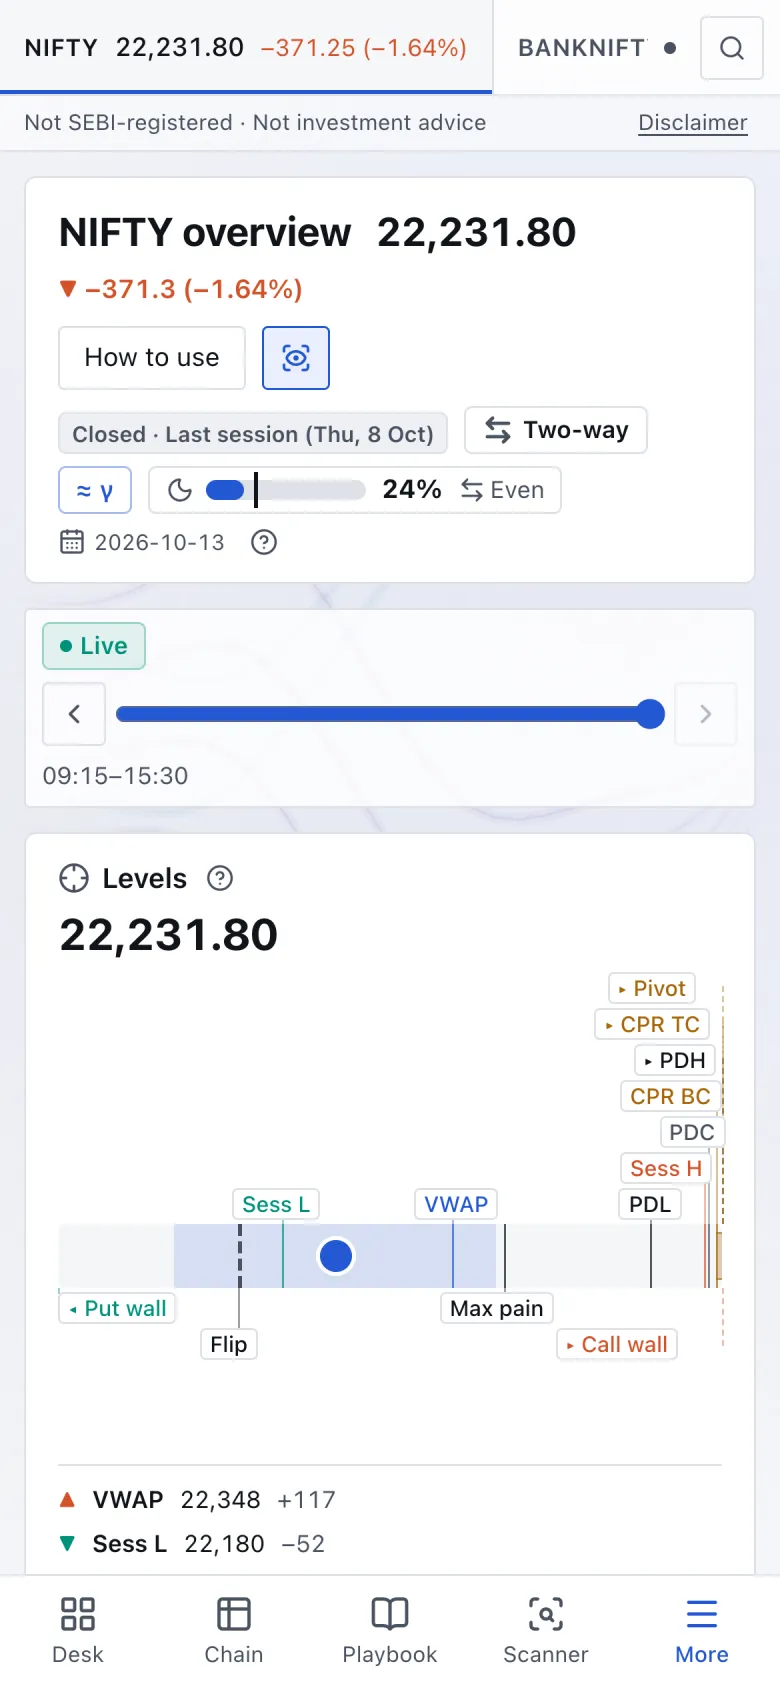
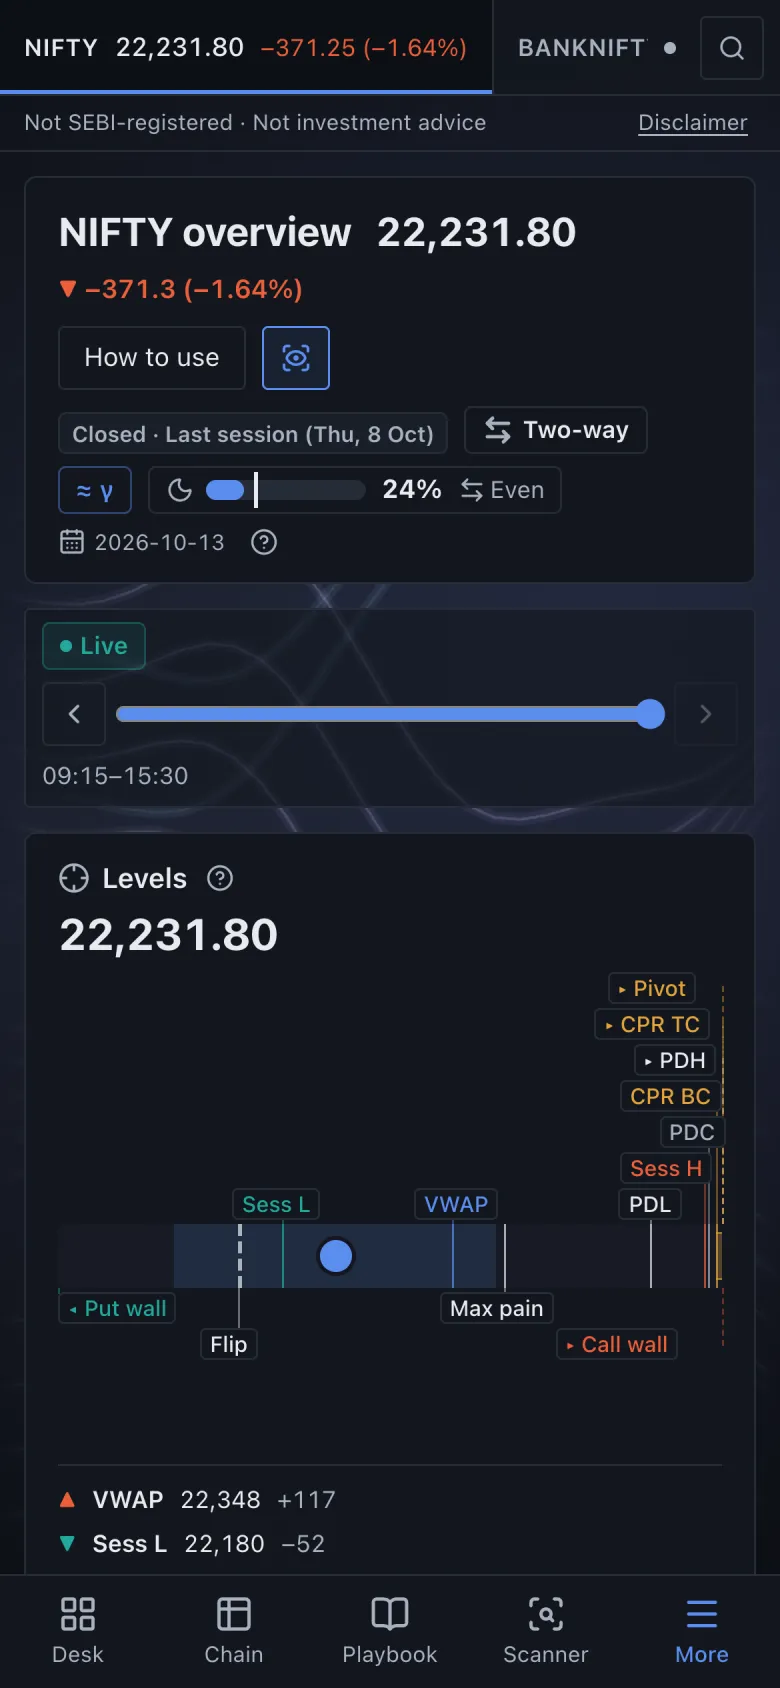
The screens a desk would keep open, for three indices. Screenshots from the live site, 8 Oct 2026.
Futures, VWAP, PCR, walls, dealer gamma and the expected move in one strip, over positioning strike by strike.
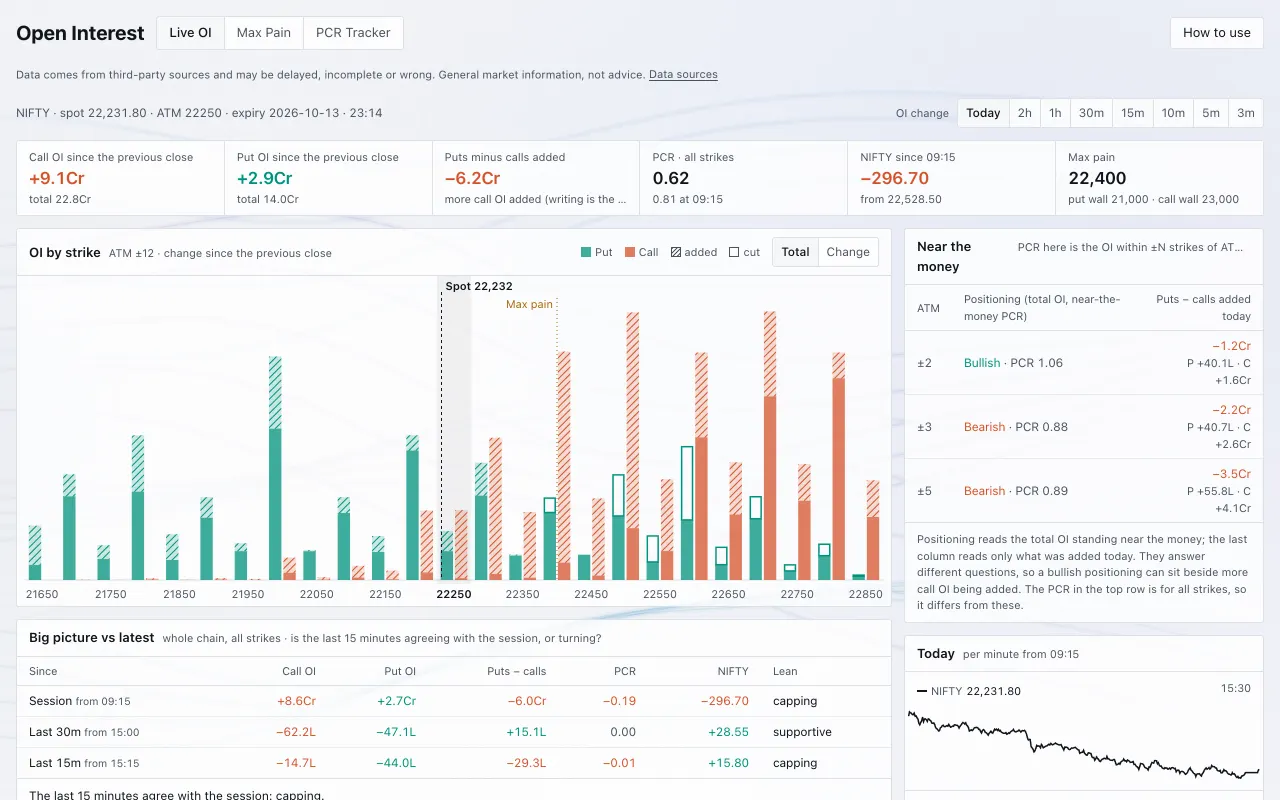
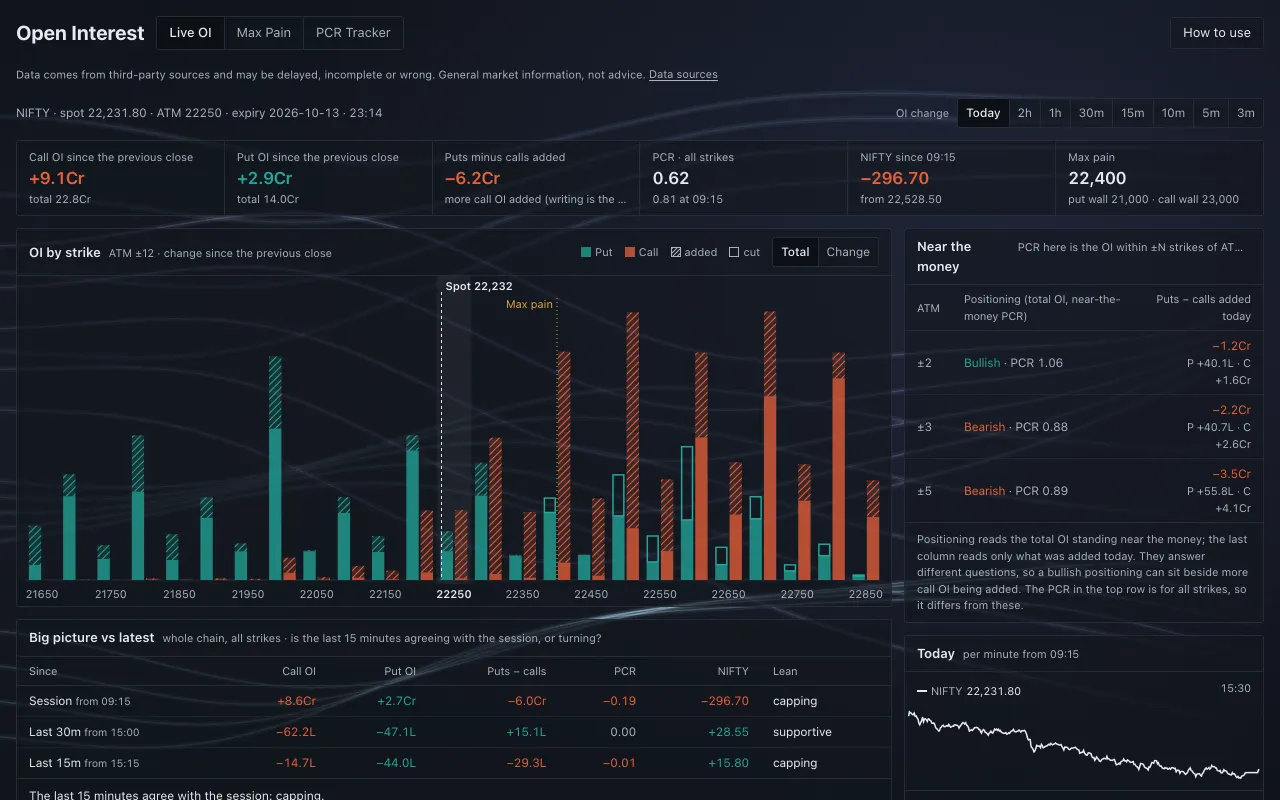
Where calls and puts are being added or cut, strike by strike, and whether the last 15 minutes agree with the session.
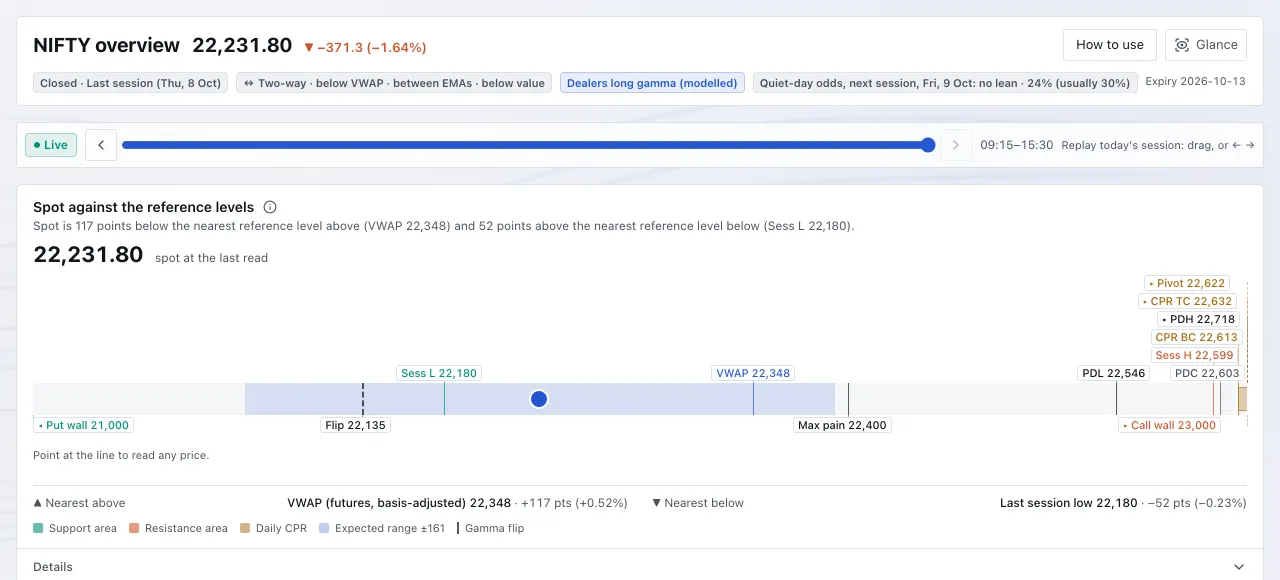
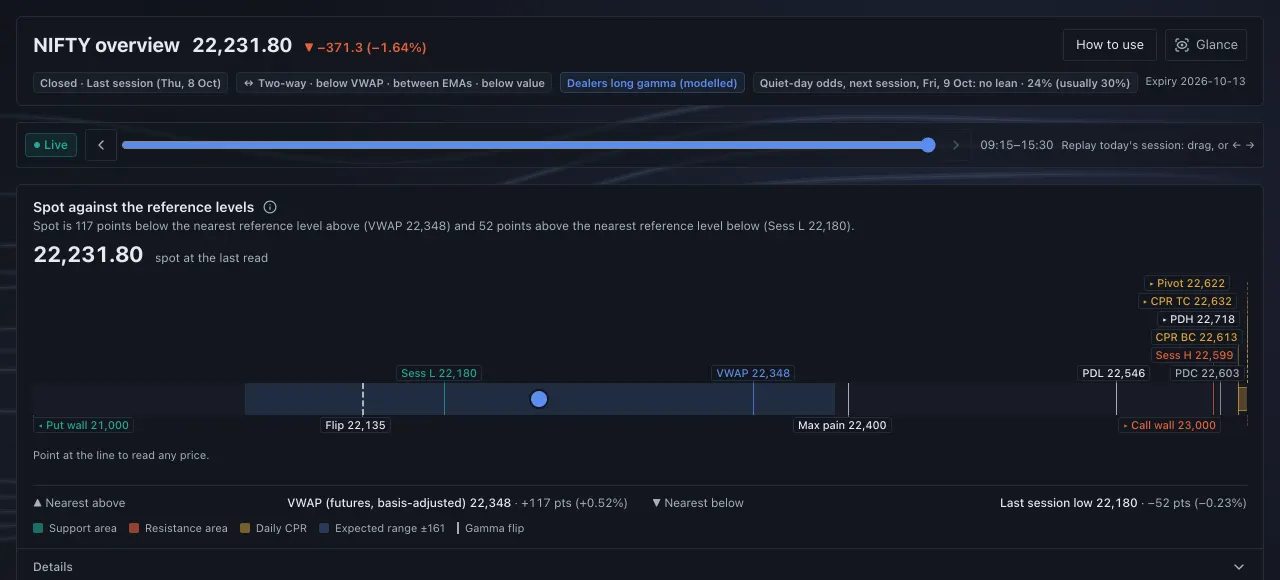
Spot against VWAP, the previous day, pivots, option walls, the gamma flip and the one-day range.
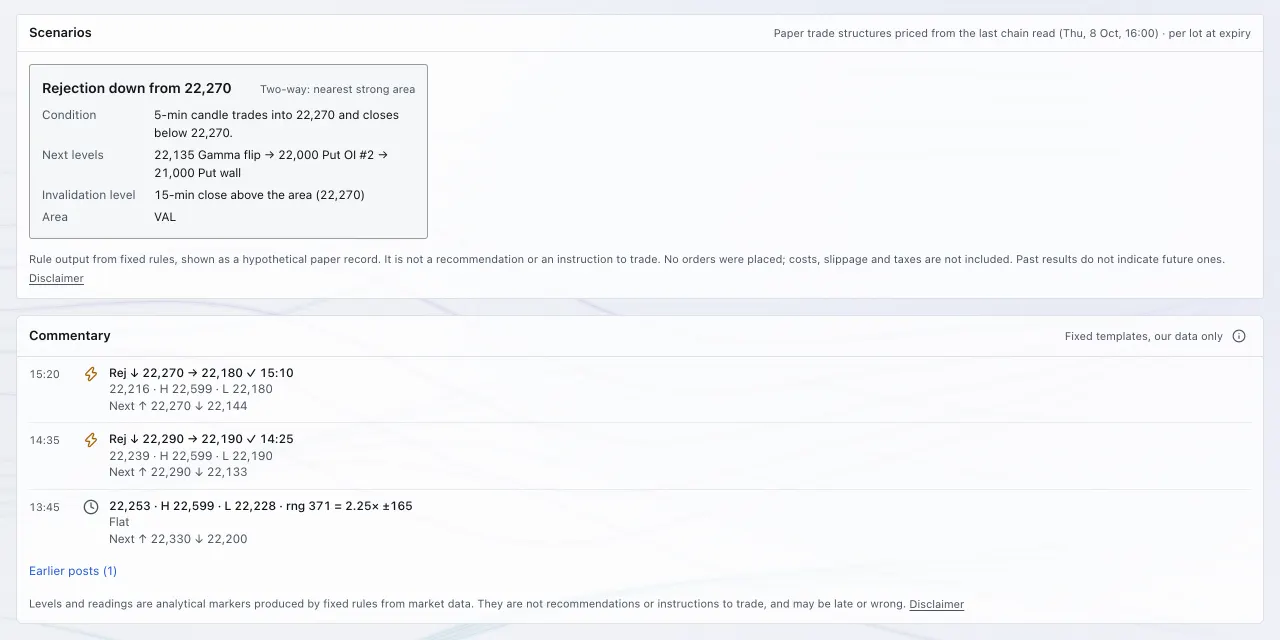
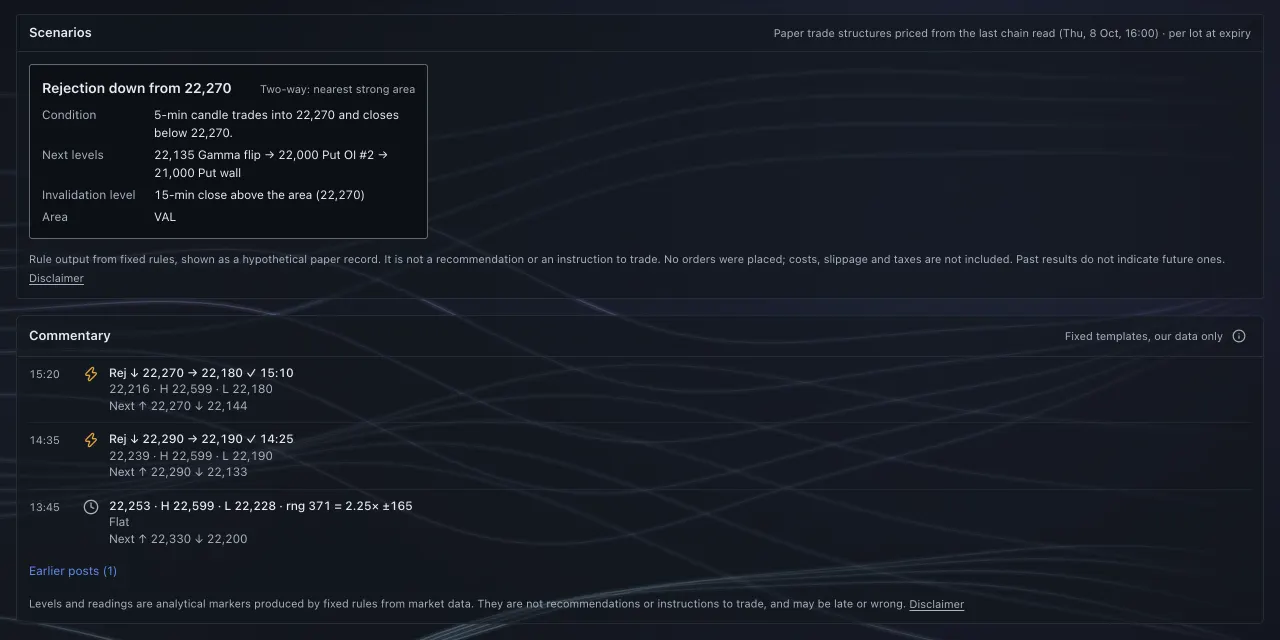
Scenarios at the nearest strong areas, each with its condition and invalidation. Commentary posts each change.
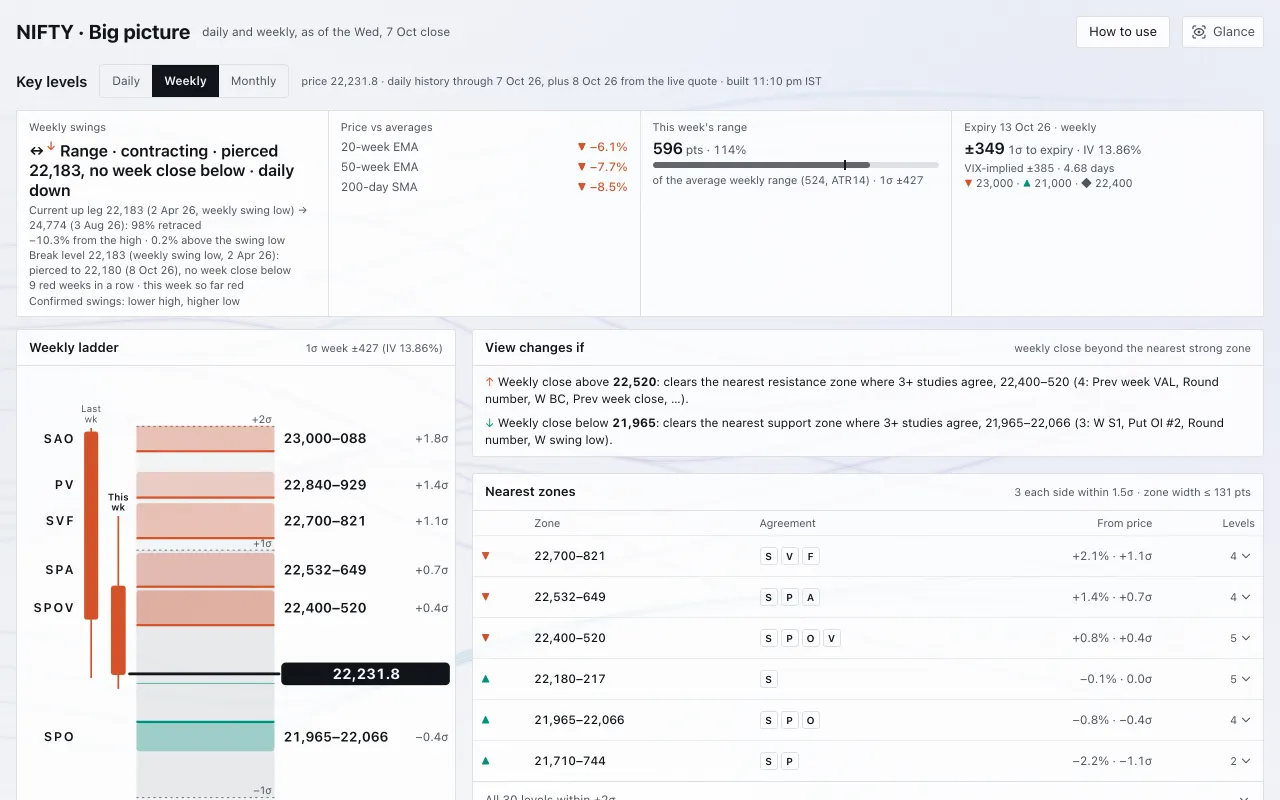
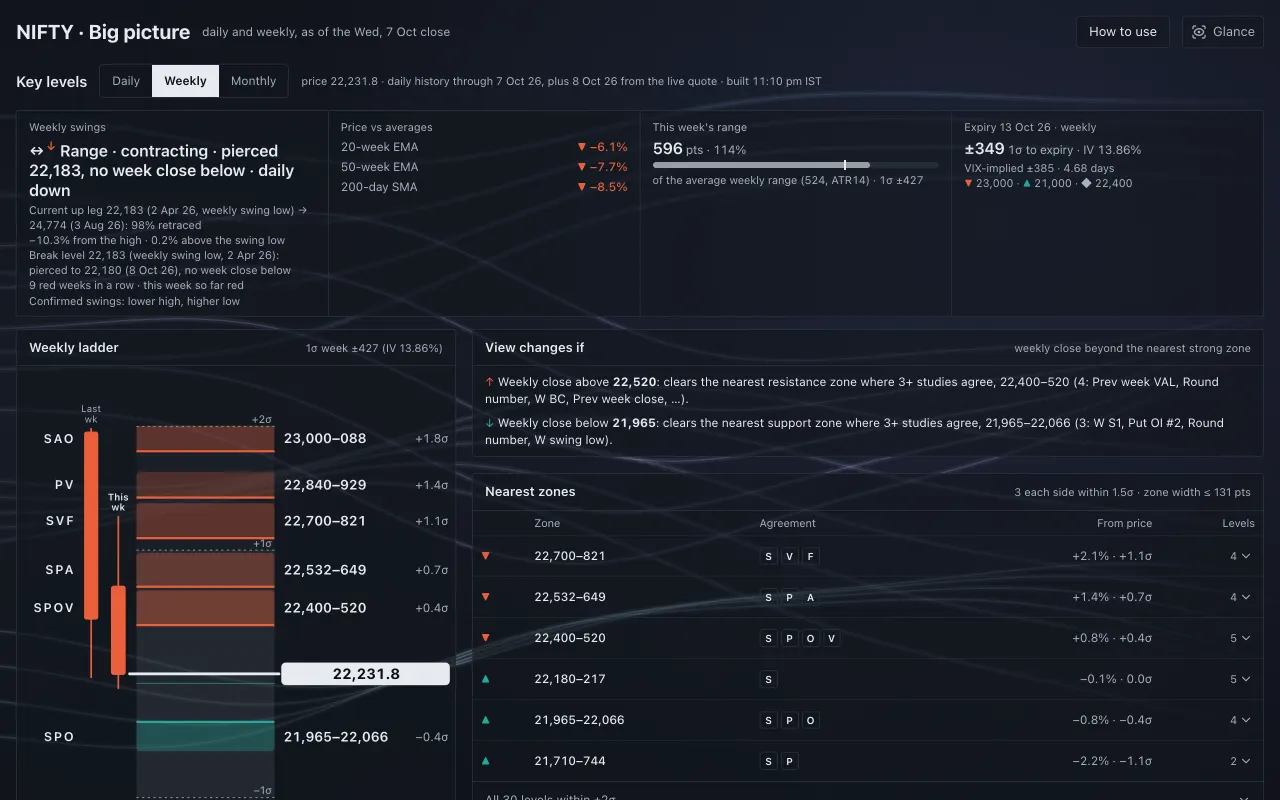
Daily, weekly and monthly trend, swings, and the zones where several studies agree.
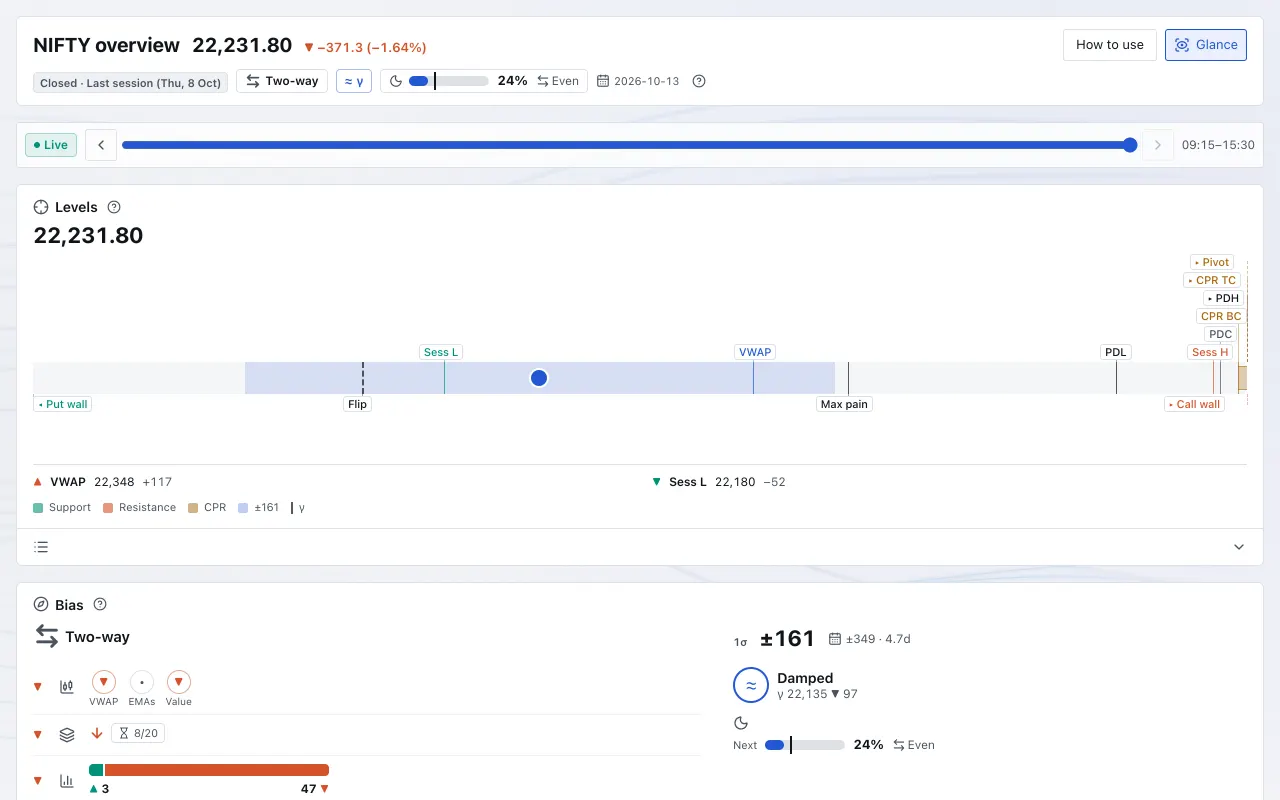
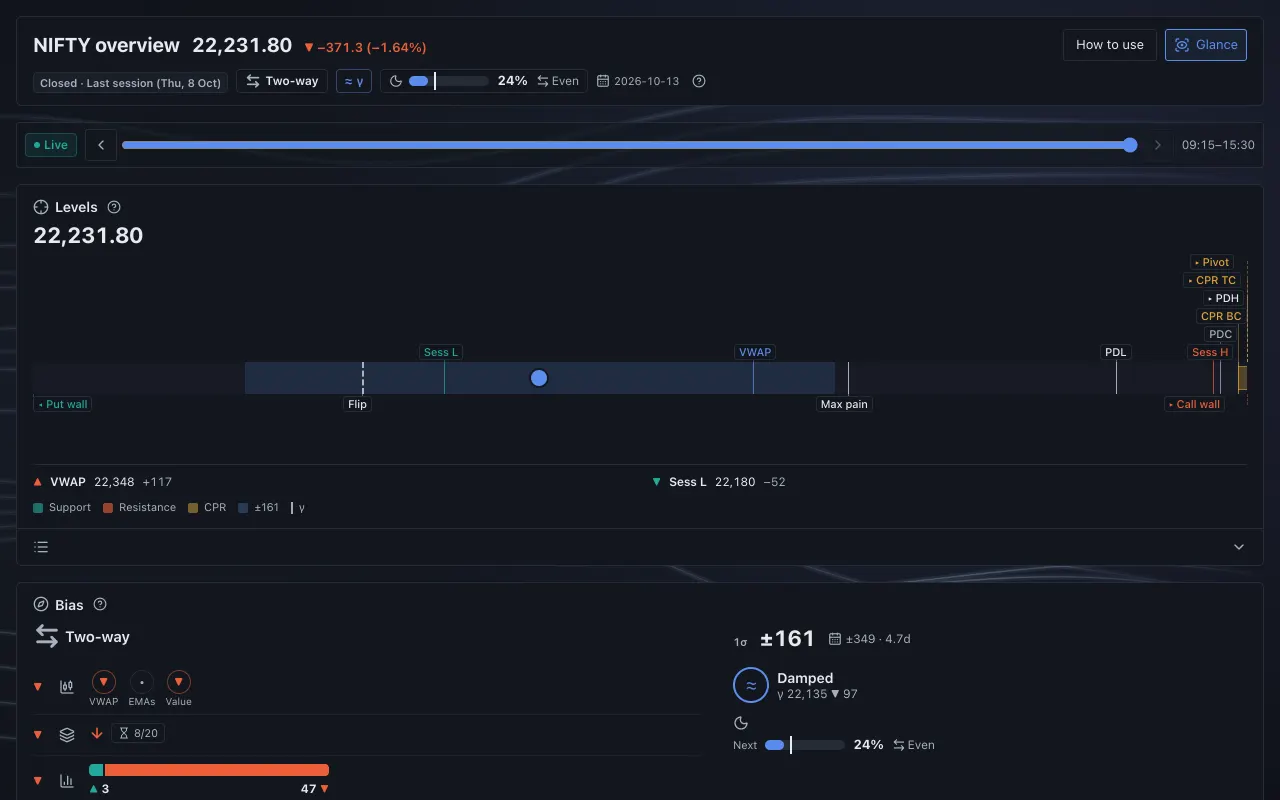
The same page in marks instead of sentences. Press G; works on a phone.
- Replay any minute of the session
- Pre-market brief
- Chain, gamma and volatility
- Sentiment from headlines and videos
- Stock scanner
- Timestamped commentary
How it works
- 1Before the open
Levels and scenarios are drawn from the option chain, the previous day and the volume profile: break above, break below, rejection, range.
- 2During the session
Each scenario moves on its own rule: waiting, in play, first level reached or invalidated. The map is redrawn at fixed times.
- 3After the close
The Scientist grades every scenario on the exchange's 5-minute candles and compares it with a fair baseline.
Watch a recorded session
The index minute by minute, with the Playbook's levels and scenarios exactly as each saved run showed them. Drag the slider to any minute.
A trend day. Most scenarios that triggered reached their target; two rejections at support failed.
Ticks under the slider: saved Playbook runs. Dots: scenarios as they triggered; graded ✓ / ✗ once the session ends.
Every graded scenario this session (12)
| Run | Scenario | Triggered | Outcome |
|---|---|---|---|
| 09:10 | Break below 22,560 | 09:25 | target |
| 09:10 | Range 22,560–22,625 | — | broke |
| 09:10 | Rejection down from 22,599–22,625 | 09:15 | target |
| 09:30 | Rejection down from 22,525–22,546 | 09:35 | target |
| 10:00 | Rejection down from 22,500 | 10:10 | target |
| 10:00 | Rejection up from 22,440–22,446 | 10:20 | invalidated |
| 10:30 | Rejection up from 22,430–22,440 | 10:45 | invalidated |
| 12:00 | Range 22,200–22,458 | — | held |
| 12:30 | Range 22,200–22,450 | — | held |
| 13:15 | Range 22,200–22,599 | — | held |
| 13:30 | Range 22,000–22,450 | — | held |
| 14:30 | Range 22,000–22,500 | — | held |
Recorded NIFTY sessions of Thu, 8 Oct 2026 and Tue, 6 Oct 2026, to 15:15. Two examples, not typical: 4 of 6 triggered scenarios reached the first level first on 8 Oct; 4 of 9 triggered scenarios reached the first level first on 6 Oct. Scenarios fail often; the record below counts every one. Levels and scenarios are analytical markers from fixed rules, not recommendations. Disclaimer
Graded in the open
After every close the Scientist checks each scenario the Playbook showed: did price reach the first level or the invalidation level first?
A hit rate means little alone, so each one sits next to a baseline: the same distances to the first level and the invalidation level, from the same minute, run over about 1,050 past sessions. When the two are close, there is no edge to speak of.
On 1,160 past sessions, the price-based directional lean was right about as often as a coin. That is why the Playbook shows both sides by default.
Scenario record so far
Updated after each close · as of Mon, 19 Oct 2026 · 15 sessions, three indices- Range held89 of 388 · 23% · no fair baseline yet
- Rejection at support101 of 140 · 72% · random 73%
- Rejection at resistance97 of 132 · 74% · random 71%
- Break below67 of 112 · 60% · random 64%
- Break above60 of 93 · 65% · random 60%
- Break, retest held46 of 85 · 54% · random 53%
- Break, no held retest60 of 82 · 73% · random 74%
79 more graded events sit in rows with fewer than 20 and are not plotted. The directional lean, when it called a side, was right 22 of 37 times (60%) against a coin's 50%. Rates are descriptive, from a small and recent sample; they are not an edge, a forecast or a measure of returns.
Free in beta with an account
Every screen, all three indices, no card. Plans are announced before the beta ends; nothing is charged without your agreement.
Questions
Where does the data come from?
Index, futures and option-chain data come through a broker's market-data feed, plus public exchange files. It can be delayed or wrong; the Data sources page has the details. Data sources
Is this investment advice?
No. OIDash is not a SEBI-registered Research Analyst or Investment Adviser. Levels, scenarios and readings are produced by fixed rules from market data. They are not recommendations, tips or instructions to trade, and OIDash places no orders. Disclaimer
Does it tell me which way the market will go?
No. Our own tests found no reliable edge in the directional lean, so the Playbook shows scenarios on both sides, each with its invalidation level, and grades them in the open.
Is it free?
Yes, while in beta, with an account. After that, plans will be announced; you will be told before anything changes, and nothing is charged without your agreement.
Why do I need an account?
The beta is by account so access can be opened in stages and feedback followed up. Request it with your email or Google account; an admin reviews each request.
Which markets?
Index options on NIFTY, BANKNIFTY and SENSEX, with market-wide pages (F&O stocks, FII/DII, sentiment) alongside.